Podcast: Play in new window | Download
Subscribe: Apple Podcasts | RSS

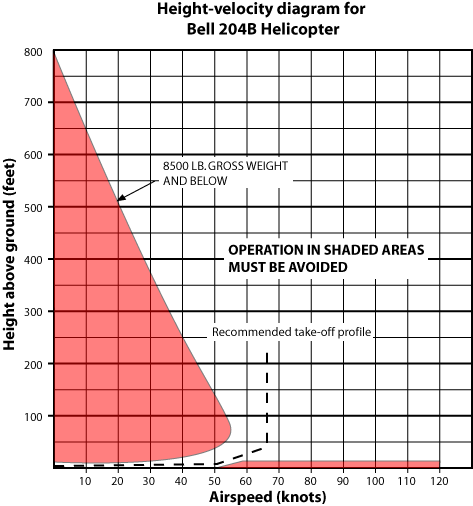
Whether you walk away from a landing after an helicopter engine failure or not depends on many things but one good predictor is the Height Velocity(H/V) diagram.
The H/V diagram (also known as H/V curve and dead man’s curve) represents combinations of airspeeds and altitudes that have been determined for that helicopter type where it will be difficult or impossible to safely land the helicopter.
But how is the diagram or chart arrived at?
What are the conditions it is tested under?
In this episode of the Rotary Wing Show test pilot Shawn Coyle takes us in great detail through the diagram and the machinations that go into building one. Shawn’s experience ranges from civil and military operational flying to certification flight testing and training experimental test pilots.
An author of several well know helicopter books Shawn also on occasion acts as an expert witness and on crash investigations.
After listening to this episode you will have a much greater understanding of how the H/V diagram is derived, what it means for your flying operations and probably a reluctance to let your hover height drift upwards.
Podcast: Subscribe in iTunes | Play in new window | Download
In this week’s episode:
01:20 Weather extremes on social media streams
01:48 Listener voicemail
03:25 Hello to our Croatian listener!
04:00 Height velocity diagram
05:50 Guest Shawn Coyle bio
06:06 Early start to flying in Air Cadets
06:47 Jet training then sent to helicopters
08:16 Freedom of action as a helicopter pilot
09:20 Test pilot school
11:42 Flying with the Brits
15:10 Writing books on helicopters
18:14 Automatic flight control systems
27:05 What is a height velocity diagram
27:50 Conditions used to record results
29:35 Where do you go to perform tests?
30:45 Other names for the curve and misnomers – ‘dead man’s curve’
32:41 Background of the diagram
33:28 Engine failure rates and lack of data
35:10 3 engine failures for Shawn
36:50 Delayed pilot response built into the height velocity diagram
41:03 Low hover point test technique
42:43 Impact of aging aircraft on curve
44:06 Number of data points required to construct the diagram
45:20 Verification process by certification authority
45:50 Paved level surface for touchdown, no zero touchdown requirement
47:10 What happens if you test on grass….
48:45 The scariest point to test and amount of nose down
50:34 Insurance impact of the height velocity diagram and limitation vs performance consideration
52:20 Low altitude, high speed section of the diagram
53:30 Best advice when you have to operate in shaded area
54:45 Applicability for approaches and arrivals
55:55 Ray Prouty dinner story
57:18 Piece of advice that you would pass on
59:20 2015 plans and travel
1:00:30 Little Book of Autorotations by Shawn Coyle
1:01:50 Sponsors trainmorepilots.com
1:02:10 WorldHelicopterDay.com
Links from this week’s episode:
Shawn’s company Eagle Eye Solutions
Shawn speaks at the CHC 2013 Safety Conference about the certification process
[leadplayer_vid id=”54B62D3BA13F5″]
[Tweet ““Measuring with a micrometer, marking with a chalk line and cutting with a chainsaw””]
[Tweet ““Know exactly what the symptoms are and exactly what you are going to do””]
[Tweet ““Never seen a helicopter say beat me, I love it!! (more than Blackhawk)””]
Have a question for Shawn or topics that you would like him to cover? Let us know in the comments.